6 Sensational Graphic Organizers that Will Get Results
I love teaching with graphic organizers. And here’s why:
He tips his head to the side, with a blank look on his face. He’s probably thinking when am I going to get lunch?”
I take a deep breath, and with my fixed smile think, Okay, let’s try this again. I launch into the third explanation of the parts of a story.
But I still get the blank look. I can almost see my words floating up and over his head.
Finally, I draw a diagram of the elements of a story and use concrete words about building a story with certain ‘blocks.’ The light bulb finally goes off.
He asks, You mean all stories have the same things in them? Because I put the words into a “structure,” he could finally see how certain elements related to one another and were put together to form a story. Any story.
Research that says teaching with graphic organizers increase learning because they spark your kids’ brains.
Have you read my brain-based teaching tips series? Using graphic organizers for brain-based teaching is tip #5. I know you’ve seen teachers use graphic organizers for years, but did you know that brain scientists’ say graphic organizers work with the brain to help us learn?
According to Nancy Gonzales of the Cult of Pedagogy blog, Decades of research with various age groups and in different content areas has shown that in general, when graphic organizers are incorporated into instruction, student learning improves. (Hall & Strangman, 2002).
How teaching with graphic organizers improve understanding.
If these are new to you, graphic organizers are simply visual ways that show how facts and ideas relate to one another. They come in various forms — Venn Diagrams, rubrics, mind/web/ concept maps, character analysis/comparison-contrast/sequence charts, to name a few.
I’m including six of my favorites in this post.
When your students read, graphic organizers make it easier for them to create a visual picture (using the framework of the graphic organizer) of the significant parts of a text, which increases their understanding. ((DiCecco & Gleason, 2002; Kim, Vaughn, Wanzek, & Wei, 2004; Manoli & Papadopoulou, 2012; Vaughn & Edmonds, 2006).
But they are helpful in other areas of learning as well. Research evidence supports the use of graphic organizers for improving student learning of content and vocabulary across subject areas. (Burke, 2009)

Graphic organizers are especially helpful for children with learning disabilities.
If your children learn in different ways, try graphic organizers!
In this article from the Penn State College of Education, author Sara LaJeunesse quotes Assistant Professor of Education Douglas Dexter discussing having identified 16 studies where graphic organizers were used with elementary to secondary students who had learning disabilities. He said, “All of the studies we evaluated showed a large, positive effect of graphic organizers on the post-test performance of students with learning disabilities.”
How graphic organizers help students learn, according to researchers.
What can graphic organizers help you teach?
In our increasingly visual culture, graphic organizers are one of the best ways I know how to teach students to:
- Understand how facts relate to one another
- Identify a sequence of events
- Learn how to take notes
- Organize their thoughts
- Write a paper in a logical way
- Understand the parts of a story
- Identify the main idea in what they are reading
- Discover different patterns in writing, in numbers, and in the natural world
So many things! And even better, they can be used from kindergarten through high school.
Below are six of my favorite graphic organizers, along with tips and examples for using each one.
Editor’s Note: This post contains affiliate links to products I’ve used and loved. Should you purchase something using one of these links, Train up a Child Publishing might receive a small amount of compensation at no extra cost to you.
Teaching with these 6 graphic organizers will help you homeschool more effectively.
1. The K-W-L Chart
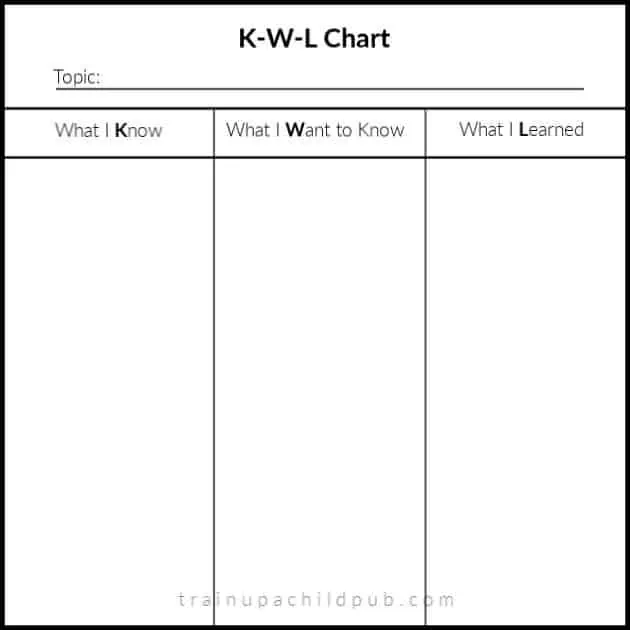
The K-W-L stands for What I know, What I want to know, and
what I learned.
Use this chart with your kids before you introduce a new topic.
It’s also useful if you’re reintroducing a topic that you learned about in the past.
For example, in our curriculum, we study history, science, language arts, and fine arts in historical and topical units that follow chronological history.
We found that repeating the units (from Creation to Modern) each year helped us to go deeper and deeper each year and that our younger kids didn’t forget so much as they did when it was three-four years before they studied a time period again. Plus, moving through the units at a quicker pace helped keep their studies fresh. But we did stop and follow rabbit trails occasionally! Anyway, often when I introduced a new topic or reintroduced one that we’d learned about the year before, we used a KWL chart.
Here’s how to use this graphic organizer.
Using a large piece of paper on an easel or a whiteboard works best if you are talking to more than one student. What I like about the sticky note paper pad on an easel is that you can peel the paper off the pad after you’ve filled up the page and put it on the wall for reference. Use one page for each section of the chart. This is helpful because your kids can add to the “What I want to know” and the “What I learned” sections as they progress through the unit.
Alternatively, if you are working with a large age span, your older kids can keep their own charts and add to the last two sections themselves.
Teaching examples using a K-W-L Chart:
- When introducing a period in history for the first time: Today we’re going to start our unit on the Ancients period. What do you think of when you think of the Ancients period of history? What do you already know about it? Later: What excites you about the Ancients period? What would you like to know about it?
- When reintroducing a unit from last year: Remember when we studied the Middle Ages last year? We are going to study that again for the next four weeks. What do you remember about the Middle Ages from last year? What would you like to learn about the Middle Ages this year?
- Use this chart when learning about an important person in history or science: a political leader, the leader of a movement, an inventor, a scientist, an artist, or a composer.
- In geography, use this before studying a country or continent.
- In science, use the K-W-L chart before studying or reintroducing mammals, the life cycle of an amphibian, or the water cycle.
2. The Venn Diagram
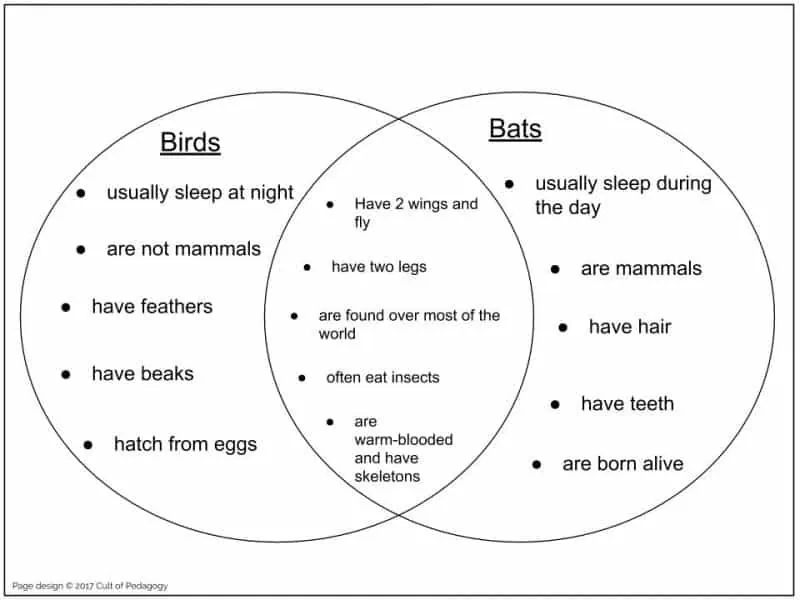
John Venn, a mathematician in the 1800s, created this type of chart. Venn Diagrams show how two (or three) things compare and contrast.
These circles show:
- What characteristics each thing has that are unique
- What characteristics each thing shares with the other
You can see that this diagram can be easily used by even primary students to better understand what is alike and what is different when comparing two or three things. But they can also be used by elementary, middle school and high school students.
Teaching examples when using a Venn Diagram:
Use a Venn Diagram when you want to compare and contrast two or three items. Ask your kids What do these things have in common? What’s different about each of them? Other ideas:
- In language arts, compare two or three stories, novels, or poems. You could also compare characters, settings, writing style of the author, vocabulary, dialect, and point of view.
- As a part of your science study, use a Venn Diagram for organisms that live in water, on land, or in the air, compare any two or three animals, kinds of fish, birds, one-celled animals, trees, flowers, grass, and much more.
- Compare and contrast two ancient or modern cultures (history or geography), such as the Maya and the Aztecs.
- Also, use Venn Diagrams for solving logic word problems or to understand sets in math.
3. The Informational Chart
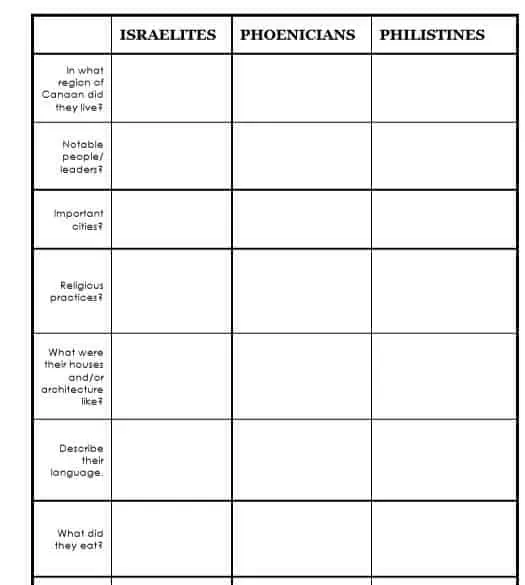
This simple chart is not busy work! Charts have a purpose. They help students learn to organize, compare and contrast information as they see it modeled for them on paper.
Organizing information on paper helps students learn to organize information in their heads. And it’s a simple way to help students how to take notes.
Additionally, this type of chart helps them to organize their thoughts in writing.
This chart above is from our Middle School Daily Lesson Plans. Students are comparing and contrasting three ancient people groups who lived during Old Testament times as they read Ancient Israelites and Their Neighbors, an independent reader during the Ancients unit.
You can see that a chart can look at similar information as a Venn Diagram, but more information usually fits on a chart. In fact, that’s the beauty of a chart: information is simplified for a chart and so easier to understand and remember.
My example here is a column chart. There are also bar graphs, pie charts, area charts, scatter charts, and more.
Teaching examples of how to use Informational Charts:
- For history, during the U.S. Colonial Unit, compare the characteristics of the Northern, Middle, and Southern Colonies. (There’s a premade chart for that in our Preparatory Unit Program.)
- Use a chart in science to record the stages of the moon, or the weather type, or the daily temperature. Use the charts to discuss: How many days does it take to go through a complete cycle of the moon? How many days did we have rain last year? So if we had rain __ days, what percentage of the year did we have rain?
- We are fortunate to have a small pond behind our house. On year a pair of Canada Geese built their nest on the bank directly across from our kitchen window. We had a great time when my kids were smaller marking every day that the mama sat on her nest before the tennis-ball-green babies hatched!
- If you plant seeds in cups before they get warm enough to plant, how many days until the peas germinate? How about the carrots? Once they’re planted outside, how much does each vegetable or herb grow per day?
Look for opportunities all around you to make charts.
4. The Anchor Chart
Rather than categorizing information like the charts above, an anchor chart graphically illustrates a model or a process in a graphic way. Use color! You can make one in front of your students, you can make one before you teach something or you can have your older children make one. Usually, they are hand-drawn. But you’ll understand anchor charts with the example below.
Here are some examples of hand-drawn charts for reference. I’ll wait for you to come back.
So as I said, anchor charts often show a process. Another purpose of an anchor chart is to present information about something in such a way that if a student gets “stuck’ trying to do something, he can look at the chart and figure out how to keep going on his own. (Therefore, an anchor chart “anchors” his knowledge and is the bridge between where he is now and the process he needs to follow to get to the answer he’s looking for.)
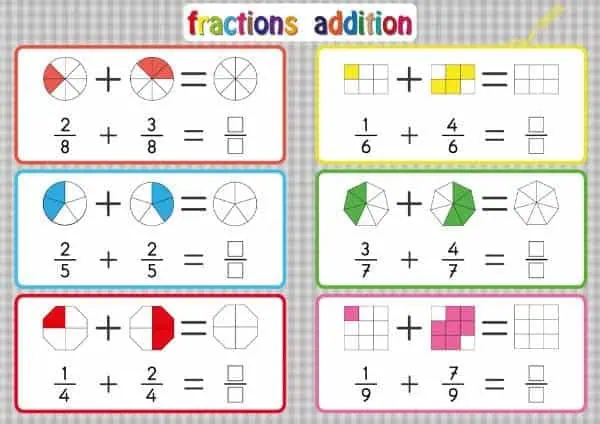
Here is an example of a chart that shows how to add fractions. With the examples given. Most third-graders can study this chart and figure out the process of adding fractions if they get stuck.
Teaching examples using anchor charts:
- When teaching writing, list the steps to self-editing at your student’s level.
- Also when teaching writing, choose the most commonly over-used words (nice, pretty, good, bad) and list some more vivid words your student can substitute for the common ones.
- Illustrate the scientific method in a graphic format.
- In science, create an anchor chart showing the steps and processes that make compost, beginning with your kitchen scraps in the house.
- Illustrate the possible points of view of a story: first person, second person, third person (limited or omniscient).
- In history, graphically represent conditions that are present before a civilization is born: a fertile area to grow food, a river nearby that provided water for people, crops, and transportation, a “safe” location that allowed for a city to grow and time for people to develop trades. A central government, religious unity, the ability to write… (There’s not just one right answer to this, by the way!)
- In fine arts, illustrate a color wheel and how to make primary, secondary, and tertiary colors.
What you need to make anchor charts:
- 11×14 paper if you want to hang it on the wall or blank notebook paper if you are making them for individuals to keep
- Decent colored marker sets of different thicknesses. Use thinner ones for words and illustrations and thicker ones for making lines to break up your chart or to emphasize different parts.
4. The Plot Map

Fifth grade students on up can use a Plot Map. It’s one of the best ways I know to learn and practice the complicated skill of identifying the main ideas in one’s reading.
To use it, teach your students to write a few sentences summarizing the main events they read about just after each day’s reading. When you’re introducing the plot map, it’s helpful to have read the passage before he reads it, at least for the first few lessons. Then you can knowledgeably talk about the main ideas from the passage with your student to make sure he’s on the right track.
Practicing this skill yields great dividends in reading comprehension, which will help your student through the rest of his academic career and beyond.
This is also incredibly useful when a middle or high school student is reading a longer chapter book and needs to refer to different parts of the book for a paper or other presentation.
5. The Rubric
As an informational chart, a rubric is basically a table. But this kind of table has four purposes.
First of all, it reinforces the idea that a story, report, paper, or project is made up of different parts.
Secondly, it helps you carefully think through an assignment before assigning it. To make a rubric, you have to clearly articulate exactly what you want your student to do.
Thirdly, it gives your student the perfect guideline to use as he completes the assignment. Teach him to look at it a few times and check it before he turns the assignment in to make sure it’s complete.
Lastly, it gives you a way to more objectively evaluate an assignment.
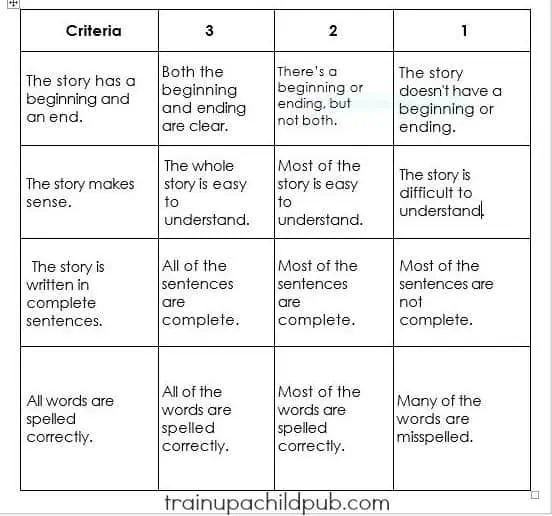
You can use simple ones for elementary students, like the one on the above, for a student who is writing a story.
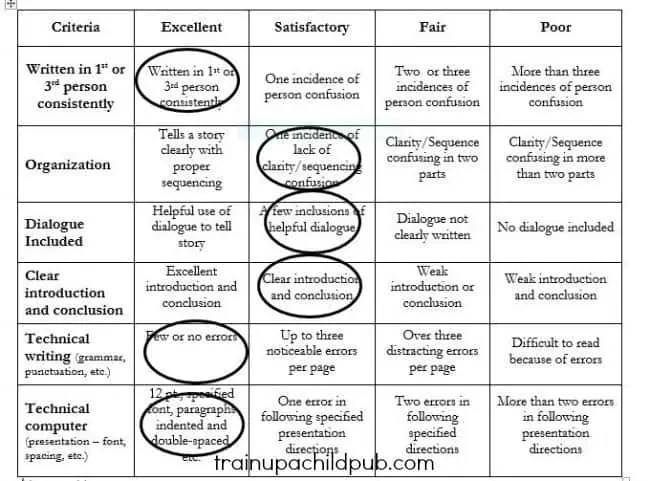
You can also use more complicated ones for older students, like the rubric below.
Rubric for a High School Student (with scoring instructions)
Here’s a rubric from World History I, one of our high school courses, about writing a Narrative Essay. A narrative essay is an essay that tells a story or recounts an event. It’s usually written from the point of view of the author. It can show humor and sometimes demonstrates how the author grew or changed as a result of the event the author experienced.
Directions for scoring this high school rubric: An easy scale of 4-excellent, 3-satisfactory, 2-fair, and 1 poor works well when grading with this level rubric. Once you’ve determined the total points earned compared to the total possible points, you can develop a percentage score.
For example, in the Narrative rubric example here, a total of 24 points is possible. If your student scored 21 out of the 24, simply divide the total scored by the total possible and multiply by 100.
21/24 x 100 = 87.5 or 88%
So, for any other rubric you do the same: Take the number of points earned divided by the total number of points possible and multiply that number by 100.
6. Mini-books and Lapbooks
If you’ve read my blog awhile you may have seen my post on lapbooks and mini-books. But if you haven’t, mini-books or “foldables,” as they’re often called, are simply little books your students can make themselves that have places to write on them.
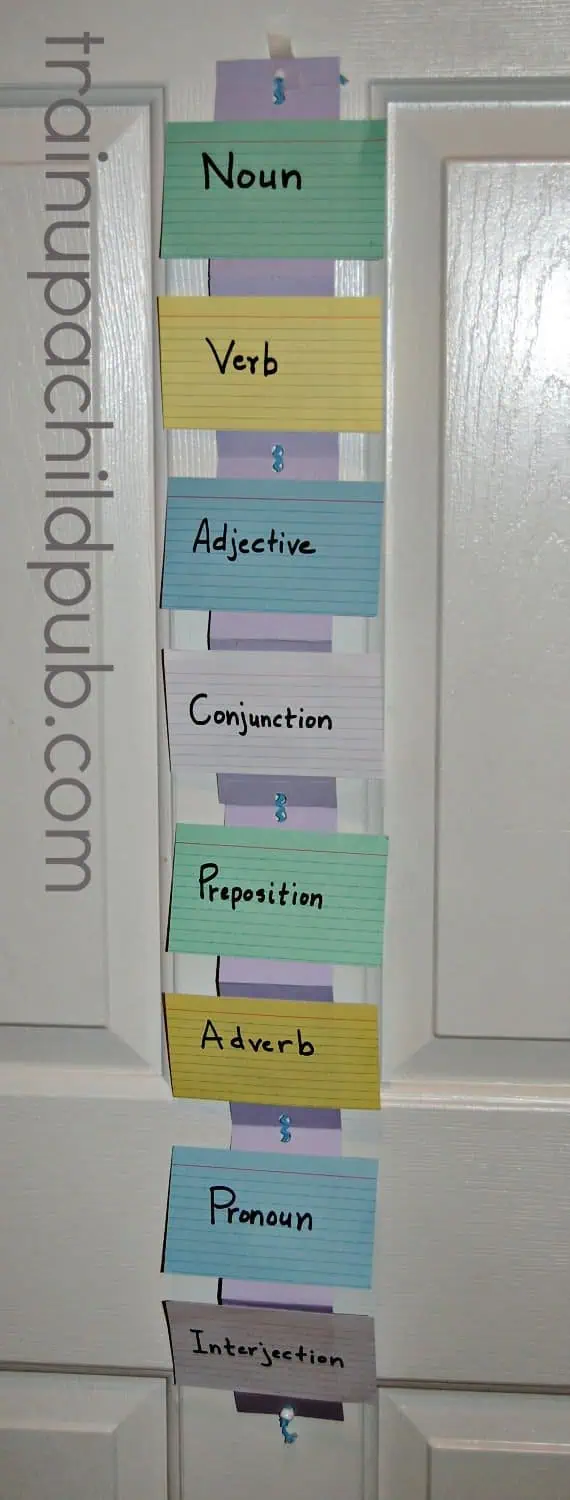
Here you can see a simple accordion mini-book we made on the parts of speech.
We made it out of 3×5 cards with each of the eight parts of speech written on its own card.
First, we glued or stapled the purple background sheets together lengthwise. Then we glued each card to the background pages.
Then we punched holes in the background paper, threaded the holes with rick-rack. and tied the rick-rack together at the top.
Two beads are threaded onto the ends and then knots tied in the rick-rack to keep the beads in place.
In the second image, you can see this mini-book unfolded.
Of all the graphic organizers, mini-books and lapbooks are the most fun. Why? Because your kids can use bright colored craft paper and can include “design elements” as well, as you can see from my example in the linked post.
For your more artistic students that love nothing better than scissors, glue, cutting and pasting (or using Velcro)… these are graphic organizers you should definitely check out.
Lapbooks are put together using mini-books glued or Velcro’d (I know that’s not a word, but you know what I mean) to manilla folders.
To find out how to put manilla folders together to make a lapbook, there are instructions (with some great photos, if I do say so myself) here.
There are plenty of places to download free templates and buy pre-made lapbook kits. But there’s also value in having your students make their own books. Then they are free to choose the colors of the paper, include their own drawings, and design how to fit the mini-books onto the lapbook in an interesting way.
A great graphic organizer to make with this type of book is a Story Sequence. Create this by having your student write the sequence of events on each of the 3×5 cards
The more investment they have in their lapbooks, the more proud of them they are. And each time they show their lapbook to a sibling, parent, grandparent, etc., they automatically review the material included! You can make lapbooks for any subject, and they are only limited by your or your kids’ imaginations!
Teaching Examples of Mini-books and lapbooks:
- Design a lapbook in the shape of a castle. Create mini-books that show the parts of a castle, vocabulary specific to a castle and castle life, online photos of famous castles, and a map of a specific area or continent where the castles included are located.
- Make a lapbook that depicts the parts of a flower, a tree, an insect, or a human skeleton. (The human skeleton one is cool to do the same size as your child.)
- Create a mini-book that shows the parts of a story for younger students: character(s), setting, plot, conflict, and resolution. For older students, add point of view, tone, mood, style, and theme. Add the definition of these terms (that would make a useful anchor chart!), or have your kids read a book and describe those story elements in that particular book.
So what concept is your child struggling with at the moment? Present the information in a graphic organizer and see if that doesn’t bridge the gap.
Happy Homeschooling!

P.S. If this teaching is new to you, check out our Unit Study Tools, Daily Lesson Plans, and High School Courses. We use graphic organizers all over the place.
P.P.S. To read more about our Brain-based Teaching Series, check out the links below.